I am Fabrice BIRASA, an emerging data analyst!
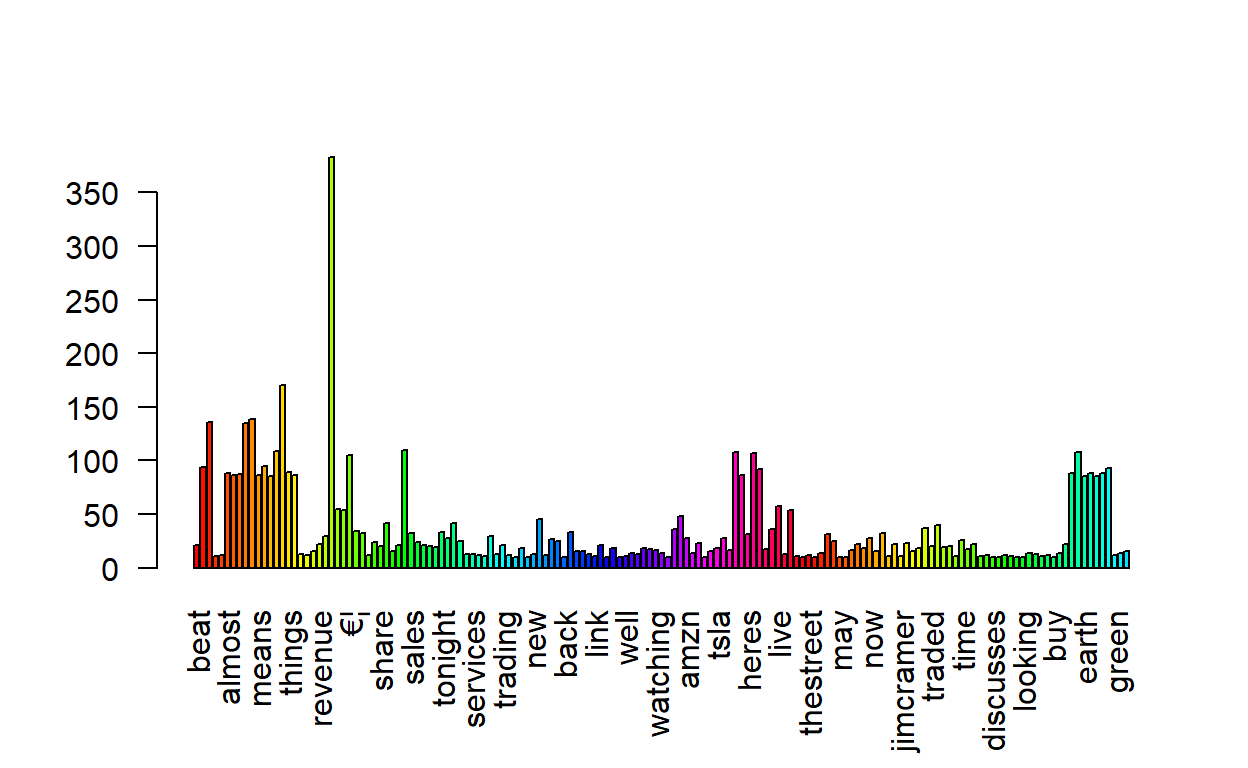
Collection of Wordcloud created with R
A short description of the post.
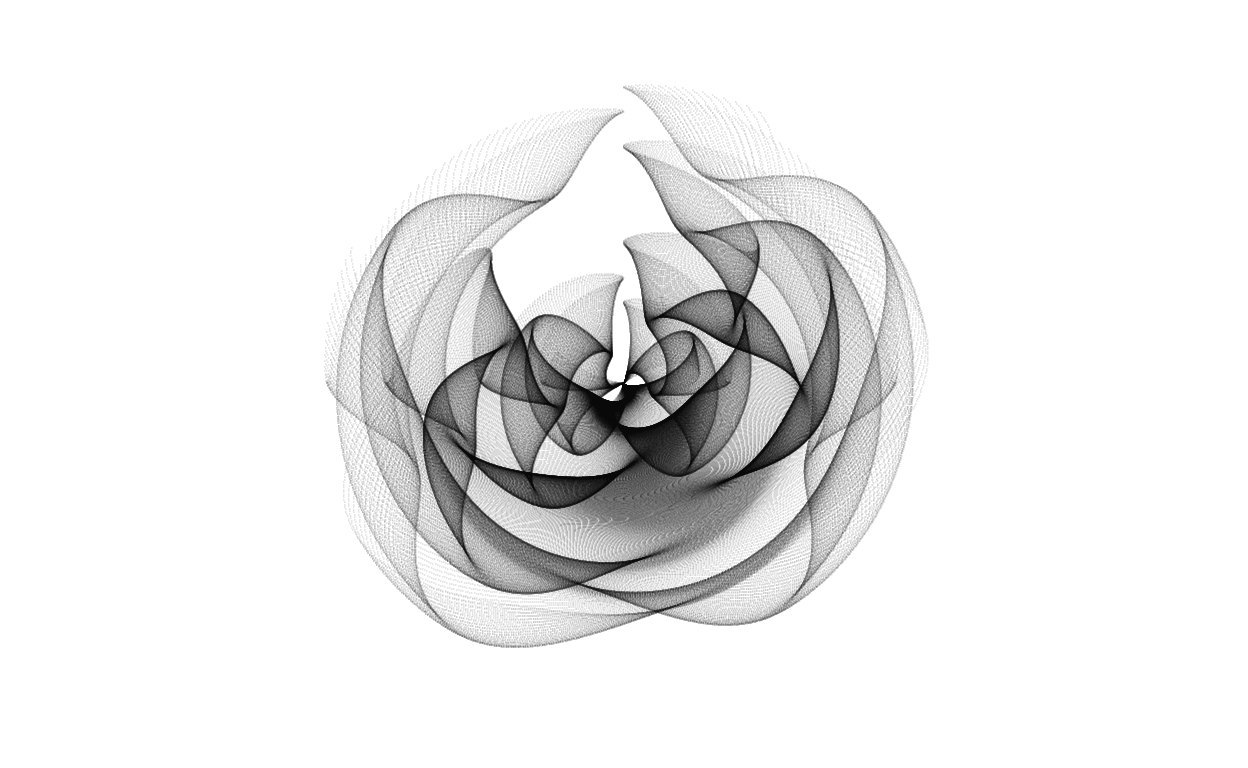
Collection of Generative Arts made in R
In this article, I will be sharing different generative arts that were made in R and are openly available along with their source code. Feel free to reach me on my details available in `About` section of this blog.
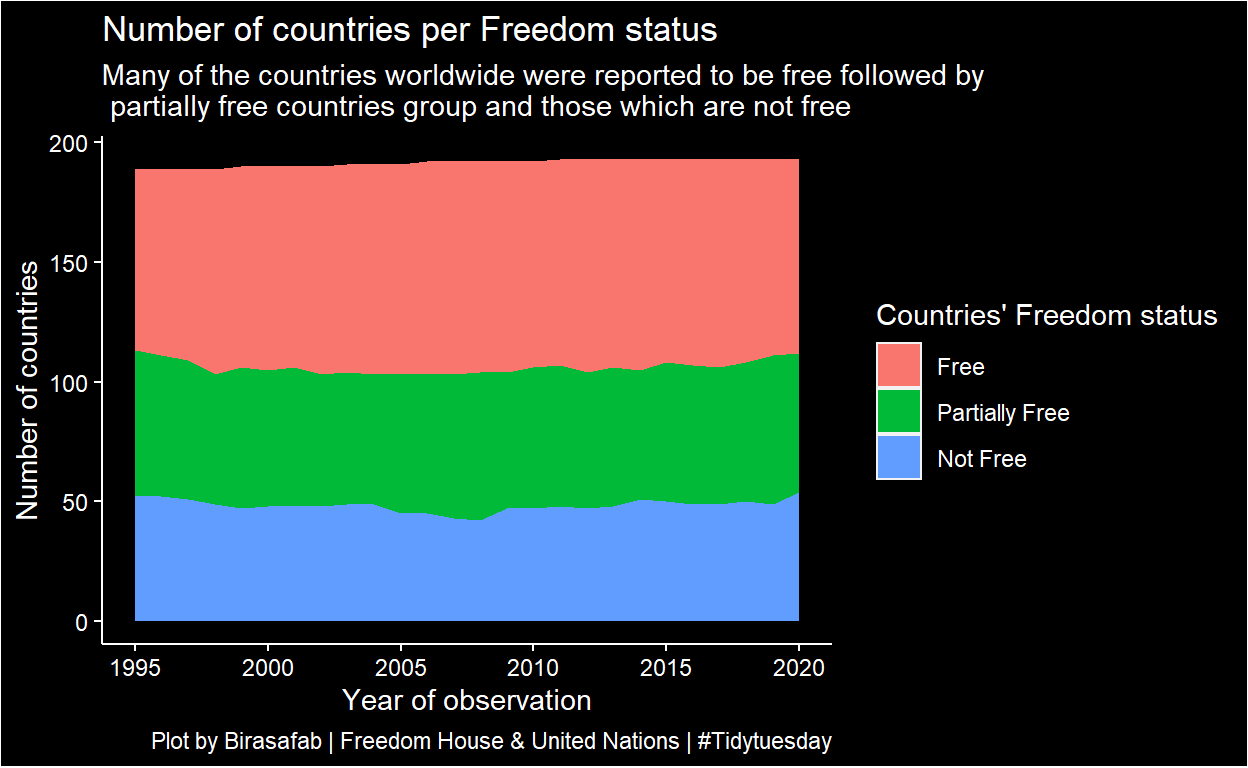
My post for Tidytuesday
In this blogpost, I will be consolidating all the weekly posts I submit for tidytuesday which is an R learning community challenge whereby R learners across the world are given datasets (either clean or not clean) and they come up with informative plots/figures, etc.
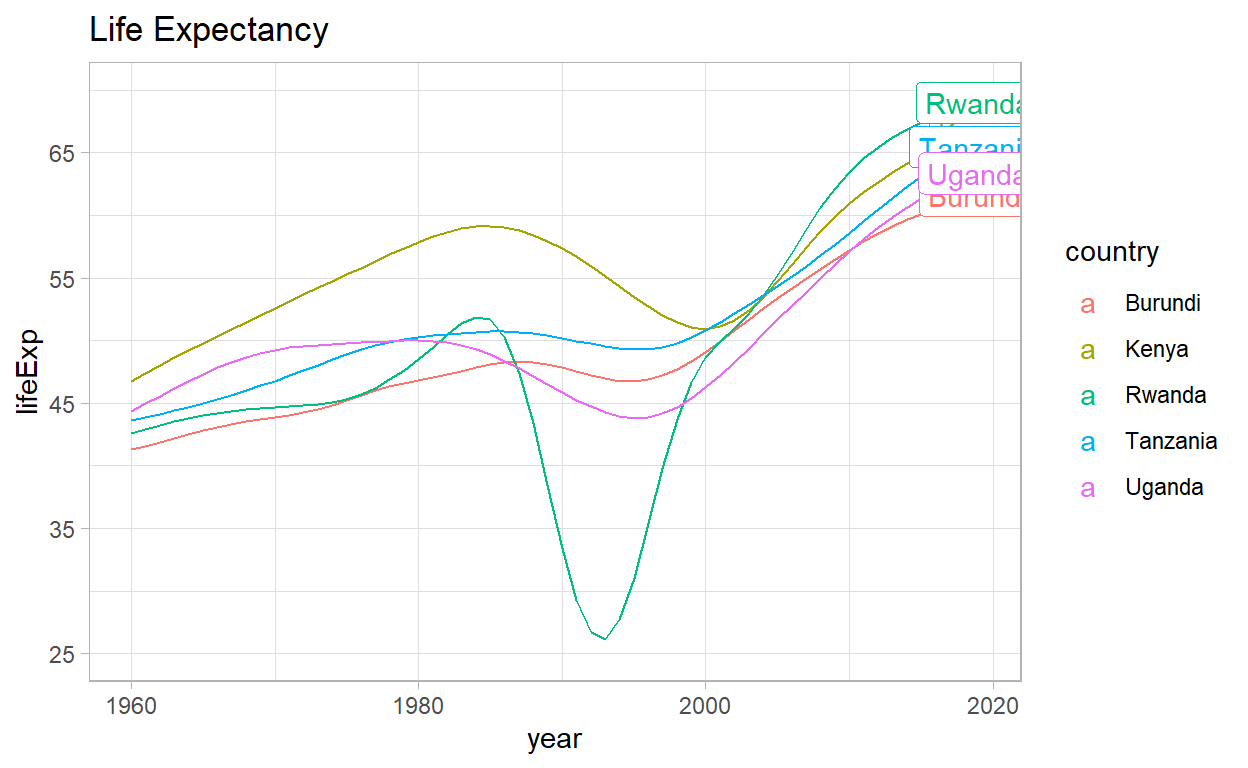
Life Expectancy trends in EAC countries
In this post, I have visualized the variation trend in EAC countries regarding the life expectancy of its citizens. I have used R Programming language for both analysis and creation of this post as well. # **Life Expectancy** in **EAC countries** has been getting better over time since **1960**.