My post for Tidytuesday
In this blogpost, I will be consolidating all the weekly posts I submit for tidytuesday which is an R learning community challenge whereby R learners across the world are given datasets (either clean or not clean) and they come up with informative plots/figures, etc.
First submission: TidyTuesday WEEK 08 (22 FEBRUARY 2022) ——————————————————————–
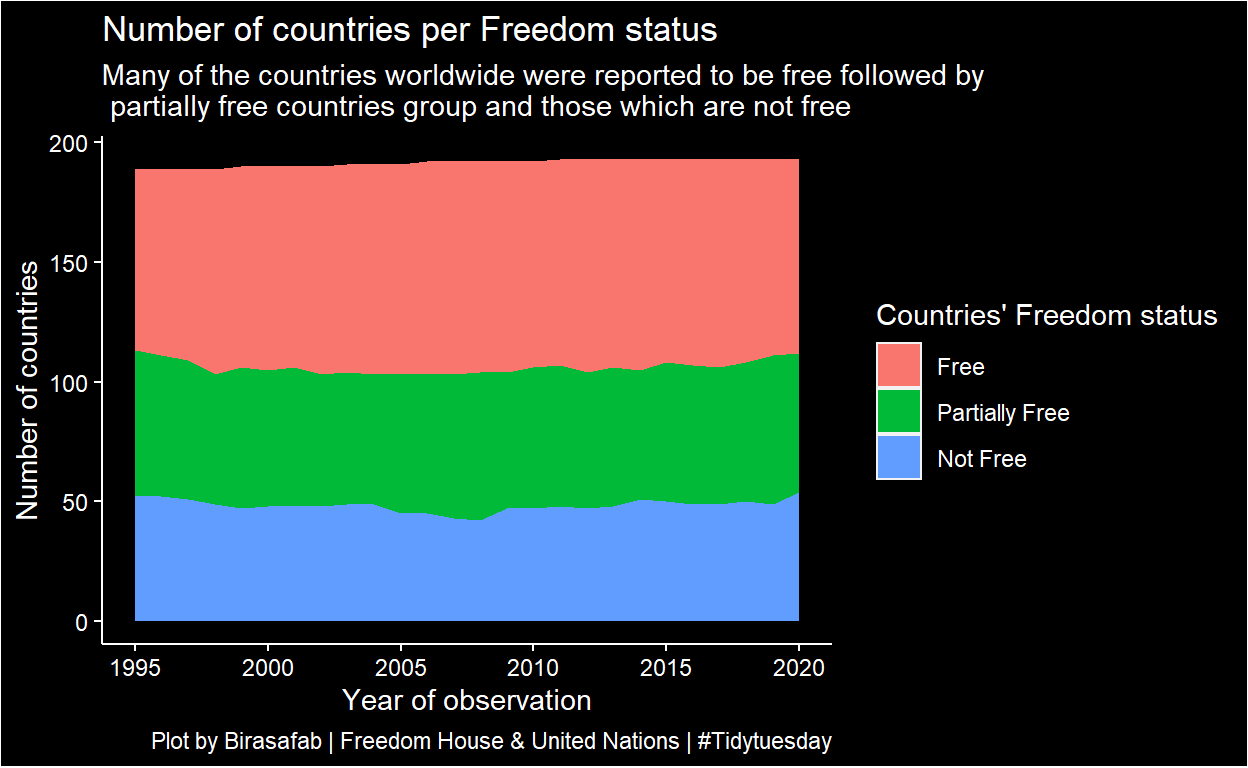
Freedom in the world
In this week’s tidytuesday, I have visualized the worldwide countries’ freedom status and the submitted plot looks like the following:
If you are interested in the above plot, feel free to view its source code
My second submission for Week 08 tidytuesday ——————————————————————–
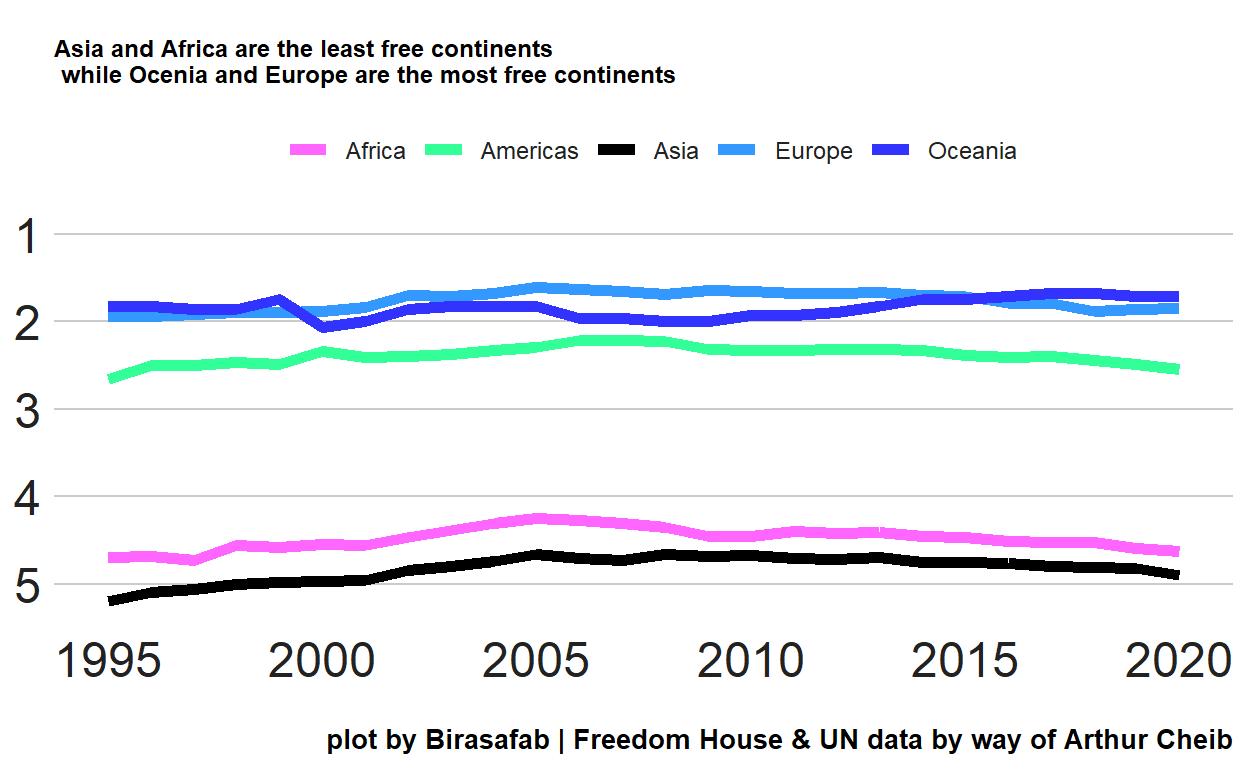
Level of freedom per continent
In the above plot, Africa and Asia were observed to the continents with the least freedom while Europe and Oceania were the continents with highest freedom.
Citation
For attribution, please cite this work as
Birasafab (2022, Feb. 22). Data Analytics: My post for Tidytuesday. Retrieved from https://birasafab.netlify.app/posts/2022-02-22-my-post-for-tidytuesday/
BibTeX citation
@misc{birasafab2022my,
  author = {Birasafab, },
  title = {Data Analytics: My post for Tidytuesday},
  url = {https://birasafab.netlify.app/posts/2022-02-22-my-post-for-tidytuesday/},
  year = {2022}
}