Introduction
In this blog post, I have used the World bank data through WDI package, I have also used bbplot package that was installed by way of pacman:: p_install.
The following is the interactive table of data I used during my analysis.
For my personal interest, I have restricted my dataset to capture only 3 indicators, those are Country name, Life Expectancy (in years) and year of observation.
Note:
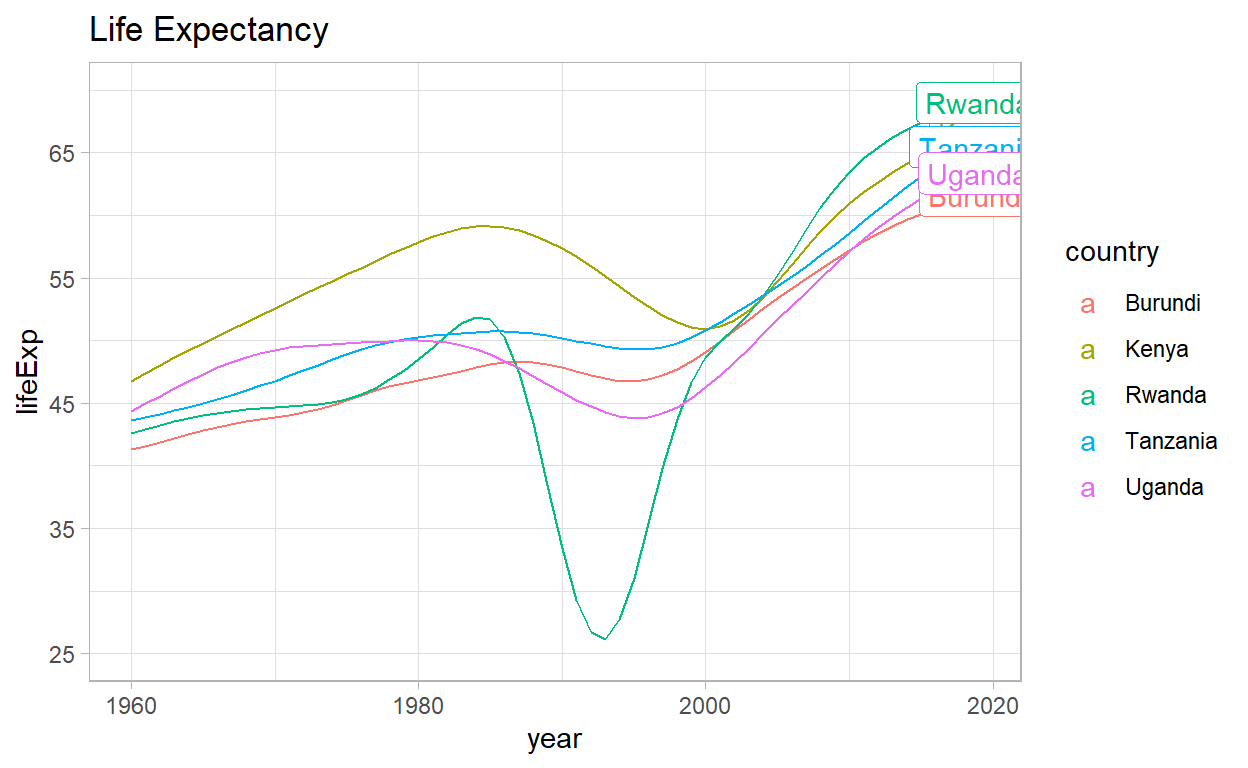
This is article is limited on visualizing Life Expectancy among the 5 EAC countries, those are Burundi, Uganda, Kenya, Rwanda and Tanzania.
The period of interest range between 1960 and 2019
As the below plot, Kenya has been ahead until replaced by Rwanda in 2000s on level of Life Expectancy among EAC countries.
Comparing EAC countries’ life expectancy by using dumbbel by using ggalt package
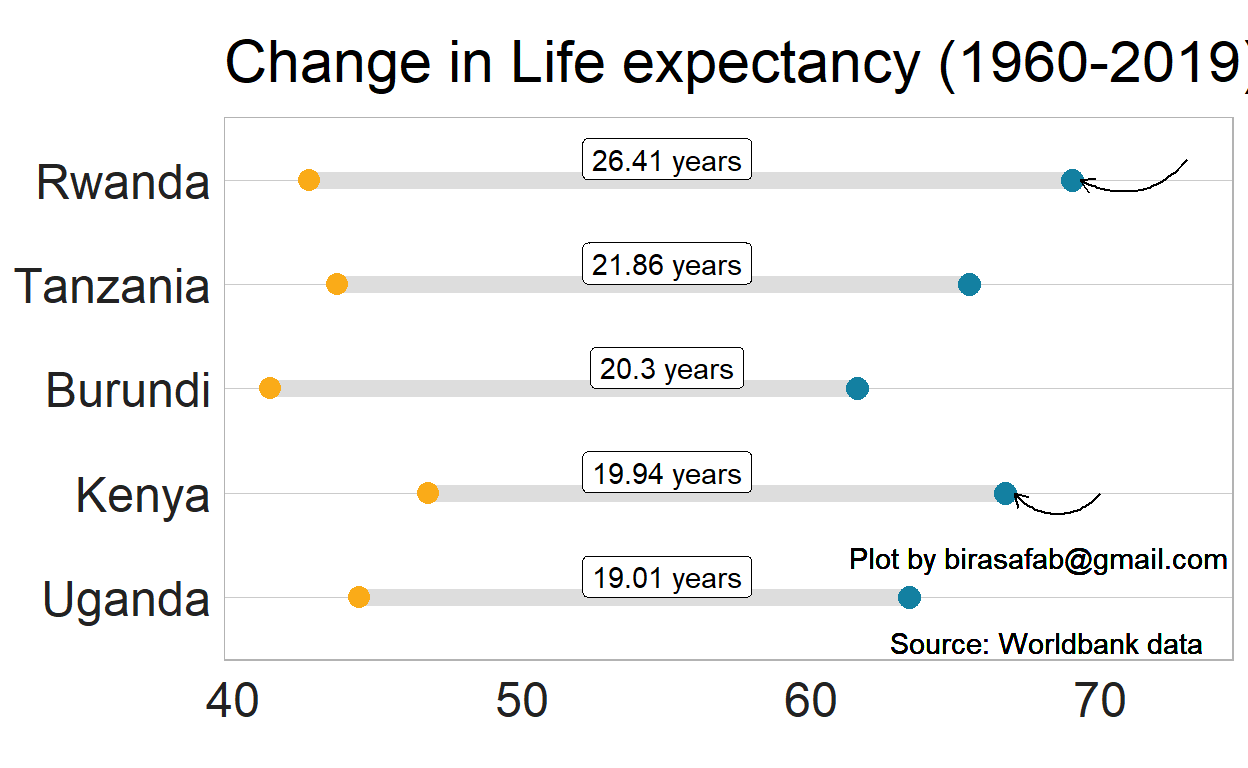
In the following plot, I have shown the change in Life Expectancy between 1960 and 2019 (taking only two individual years). Rwanda is the first country with the highest increase in Life Expectancy by considering countries records in both 1960 and 2019, Kenya being the Second countries on record has been on good track before being replaced by Rwanda. Tanzania is the Third followed by Uganda and Burundi respectively.
General Conclusion
When comparing countries’ Life Expectancy in 1960 versus that of 2019, EAC countries’ Life Expectancy have increased as the following:
Rwanda: 26.41 years (being the first country with highest increase and is the one which has the highest Life Expectancy as of 2019 with 69.024 years)
Tanzania: 21.86 years
Burundi: 20.3 years
Kenya: 19.94 years (being the second country with highest life Expectancy as of 2019)
Uganda: 19.01 years
Generally, Life Expectancy among EAC countries has been rising between 1960 and 2019, this is might be attributed to the improvement in security within these countries, Policies in place, etc.
Sources:
World Bank Data, accessed through
WDIpackage;bbplotpackage developed by BBC data reporting team;further notes on the alignment used within this Rmarkdown document, kindly refer to this link
Future interactions
Should you seek any further interactions with me, kindly find more details about me in the About tab in the top-right corner of this blog.
Thank you for having interest in my blog post. May God bless you!
Birasafab.